U+-Y+
这个gnuplot脚本是我用于处理Incompact3d产生出来的统计结果(如何统计部分,暂时未写)的画图脚本。
数据段
注意gnuplot处理数据文件按照空行划分index部分。所以下面的部分总共有四个index,调用方式是
- plot “文件名” index 0 第一部分文件信息的打印
- plot “文件名” index 1
- plot “文件名” index 2
- plot “文件名” index 3
具体看gnuplot脚本部分。
0 2.9684e-24
0.7369 0.73552
1.4746 1.4677
2.2139 2.195
2.9556 2.915
3.7005 3.6242
4.4495 4.3184
5.2034 4.9934
5.9631 5.6455
6.7295 6.2713
7.5034 6.8686
8.2859 7.4358
9.078 7.9722
9.8806 8.4777
10.695 8.9528
11.522 9.3986
12.363 9.8162
13.219 10.207
14.092 10.573
14.983 10.916
15.894 11.236
16.825 11.537
17.779 11.819
18.759 12.084
19.764 12.334
20.799 12.569
21.864 12.791
22.963 13.001
24.099 13.201
25.273 13.391
26.49 13.572
27.753 13.745
29.065 13.911
30.431 14.071
31.855 14.225
33.343 14.374
34.899 14.52
36.529 14.661
38.24 14.8
40.04 14.936
41.936 15.07
43.936 15.202
46.052 15.333
48.292 15.464
50.669 15.594
53.196 15.725
55.887 15.856
58.756 15.989
61.819 16.124
65.096 16.262
68.603 16.402
72.361 16.544
76.389 16.69
80.706 16.838
85.33 16.988
90.276 17.139
95.557 17.288
101.18 17.434
107.14 17.572
113.42 17.7
120 17.813
126.85 17.906
133.91 17.975
141.11 18.017
148.4 18.03


5 0
5 20


30 0
30 20


120 0
120 20
gnuplot处理部分
set ter 'png'
set out 'fit1.png'
set xlabel "Y+"
set ylabel "U+"
set xtics font 'Times-Roman, 15'
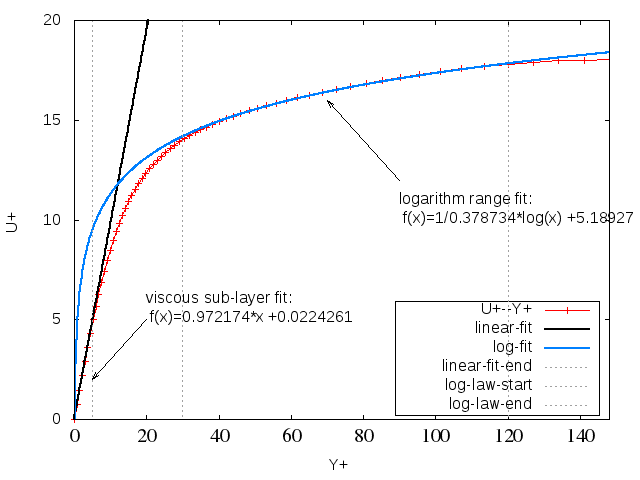
f(x)=a*x+b
g(x)=1/k*log(x)+B
fit [0:5] f(x) "umfit.dat" index 0 via a,b
print "a:=",a,"b=",b
fit [30:148] g(x) "umfit.dat" index 0 via k,B
print "k=",k,"B=",B
set xtics 20
set samples 1280
set key right bottom box
set arrow from 20,5 to 5,2
set label sprintf("viscous sub-layer fit:\n f(x)=%g*x +%g", a,b) at 20,6
set arrow from 90,12 to 70,16
set label sprintf("logarithm range fit:\n f(x)=1/%g*log(x) +%g",k,B) at 90,11
#set logscale x
#set xrange
#set yrange [0:0.5]
#[0:220][0:0.04] # the most important place is here
plot [0:148][0:20] "umfit.dat" index 0 w lp pt 1 t "U+--Y+",f(x) w l lt -1 lw 2 t "linear-fit",g(x) w l lt 3 lw 2 t "log-fit",\
"" index 1 w l lt 0 t "linear-fit-end","" index 2 w l lt 0 t "log-law-start","" index 3 w l lt 0 t "log-law-end"
处理结果
一些实时监测部分
执行部分:
a.sh
mpirun -np 8 incompact3d >> tail.out &
获取信息部分
image.sh
more tail.out | grep DIV | grep U* |grep Max|sed '/final/d'| awk -F'=' '{print $2}' |sed '1,3d'> divu
more tail.out | grep UT | awk  '{print $4}'|sed '1,2d' > flow-rate-correction-factor

#more tail.out | grep zhao | awk '{print $2,$3,$4}' > stretching

more tail.out | grep PHI | grep max|awk -F'=' '{print $2}' > PHImax

more tail.out | grep PHI|grep MOYEN | awk  -F":" '{print $2*10^4}'> PHImoyen
#gnuplot monitorFLOWRATE.gnu

bash monitor.sh
打印部分
monitor.sh
#!/bin/bash
#===============================================================================
#
#          FILE:  monitor.sh
#
#         USAGE:  ./monitor.sh
#
#   DESCRIPTION:
#
#       OPTIONS:  ---
#  REQUIREMENTS:  ---
#          BUGS:  ---
#         NOTES:  ---
#        AUTHOR:  Ye Zhaoliang (YZL), zhaoturkkey@163.com
#       COMPANY:  NCEPU
#       VERSION:  1.0
#       CREATED:  2014年10月28日 09时42分15秒 CST
#      REVISION:  ---
#===============================================================================

# set yrange [0:2]
# set xlabel
# set ylabel
function mainpoint()
{
 #   echo $0;
#    echo $1;
gnuplot<<EOF
set ter 'png'
set out '$1.png'
set grid
plot '$1' w p pt 2
EOF

}

function mainline()
{
 #   echo $0;
 #   echo $1;
gnuplot<<EOF
set ter 'png'
set out '$1.png'
set grid
set yrange [0:2]
plot '$1' w l lt 2
EOF


}

#mainpoint ux2
#mainpoint uy2
#mainpoint uz2
#mainpoint ux5
#mainpoint uy5
#mainpoint uz5
#mainline uy2
mainpoint divu
mainpoint flow-rate-correction-factor
#mainpoint stretching
mainpoint PHImax
mainpoint PHImoyen
#mainpoint averageux2
#mainpoint averageux5
#mainpoint rxx2
#mainpoint rxx5
#mainpoint dudy_bottom_spatial_only
#mainpoint dudy_top_spatial_only
#mainpoint dudy_bottom_spatial_time
#mainpoint dudy_top_spatial_time

#new add  stress
#mainpoint umean
#mainpoint vmean
#mainpoint wmean
##mainpoint uu
##mainpoint vv
#mainpoint ww

#mainpoint stressu
#mainpoint stressv
#mainpoint stressw
#mainpoint stressuv
#mainpoint stressuw
#mainpoint stressvw
整合部分
cut -c的目的是获取具体对应的时间步,然后把所有的png相关信息 放到对应时间步文件夹中。
cd /home/Cedric/diric/src && more tail.out |grep Time|awk '{print $4}' |tail -1|cut -c 1-6 |awk '{cmd="mkdir step"$1;system(cmd);system("sh image.sh");cmd2="mv *.png step"$1;system(cmd2);} '

# END{cmd3="mv dudy* umean stress step"$1;system(cmd3)}
实时浏览
切换到对应的文件夹
$ python -m SimpleHTTPServer
然后就可以打开 127.0.0.1:8000进行浏览了。
You can also use crontab to execute program in real time
crontab -e
Then you can copy the info below,but modified the datatime.
0 23 19 6 * sh /home/simulation2_128-117-128Re4200/main.sh
30 23 19 6 * sh /home/simulation2_128-117-128Re4200/main.sh
0 0 20 6 * sh /home/simulation2_128-117-128Re4200/main.sh
30 0 20 6 * sh /home/simulation2_128-117-128Re4200/main.sh
0 1 20 6 * sh /home/simulation2_128-117-128Re4200/main.sh
30 1 20 6 * sh /home/simulation2_128-117-128Re4200/main.sh
0 2 20 6 * sh /home/simulation2_128-117-128Re4200/main.sh
30 2 20 6 * sh /home/simulation2_128-117-128Re4200/main.sh
0 3 20 6 * sh /home/simulation2_128-117-128Re4200/main.sh
30 3 20 6 * sh /home/simulation2_128-117-128Re4200/main.sh
0 4 20 6 * sh /home/simulation2_128-117-128Re4200/main.sh
30 4 20 6 * sh /home/simulation2_128-117-128Re4200/main.sh
0 5 20 6 * sh /home/simulation2_128-117-128Re4200/main.sh
30 5 20 6 * sh /home/simulation2_128-117-128Re4200/main.sh
0 6 20 6 * sh /home/simulation2_128-117-128Re4200/main.sh
30 6 20 6 * sh /home/simulation2_128-117-128Re4200/main.sh
0 7 20 6 * sh /home/simulation2_128-117-128Re4200/main.sh
30 7 20 6 * sh /home/simulation2_128-117-128Re4200/main.sh
令狐冲
Engineer of offshore wind turbine technique research
My research interests include distributed energy, wind turbine power generation technique , Computational fluid dynamic and programmable matter.