gnuplot的核心是plot
gnuplot是一种科学绘图的开源软件,比origin强上不少。 而gnuplot的核心就是这个plot。
数据表:
注意 #+tblname:字段是emacs的org-mode可以识别的,可以通过#+begin_src 的:var data=data-table来引用这张表的数据。
#+tblname: data-table
| x | y1 | y2 |
|---+----+----|
| 0 |  3 |  6 |
| 1 |  4 |  7 |
| 2 |  5 |  8 |
另外,本文一直会使用的引用emacs的babal_gnuplot在gnuplot当中的运用#begin_src gnuplot :var data=data-table :exports code :file foo.png分别代表的意思是
+ :var data=data-table
When data is to be plotted from a table, it is helpful to use a heading right above the table in the form #+tblname=data-table, where "data-table" is replaced with some short name to identify the table to gnuplot.
+ :exports {code, results, both, none}
When the code is run and the document exported (e.g. to HTML or \LaTeX PDF), what should appear? Just the code block itself? Only the produced output (in this case a plot of some sort)? Both the code and the accompanying results? Or nothing?
+ :file foo.{png,eps,etc.}
This option specifies where the resulting output should be put. If no option is given, a gnuplot window will open with the resultant plot. NOTE: Certain plot options may not output properly to gnuplot directly and thus must have the :file filename option in the header. If the error "Code block produced no output" recurs, try outputting to a file instead of directly to gnuplot.
另外一个不需要记住的Named tics的写法如下
- 为了增加刻度标注
set xtics ("Tic 1" -1, "Tic 2" 10, "Tic 3" 1001)
- 为了增加可读性
You can rotate tic marks for increased readability by specifying an angle at which to rotate their labels. Here is the syntax (substitute any angle value for -45):
set xtics rotate by -45
set ytics rotate by -45
- 为了阻止双轴
The gnuplot default is for tics to show up on both sides and the top and bottom of the graph. In other words, the tics on the left y-axis and bottom x-axis are "mirrored" to the opposing side of the plot borders. Stop this (tics only on left/bottom) by using:

set xtics nomirror
set ytics nomirror
步入正题 Plot – the core of the gnuplot
plot what?
function.
f(x) = x**2
plot f(x)
data.
plot data using x:y
plot how?
plot data u 1:2 with lines
主要包括以下几种类型
- points(p)
- dots(d)
- lines(l)
- linespoints(lp)
- impulses(i)
- steps
- boxes
当然你也可以使用(–> 表示简写为)
- lineweight –> lw
- with –> w
call it what?
###你也可以给一张图加上title标题
plot data u 1:2 w lines lw 2 title 'Data Set 1'
你也可以忽略一个plot的key,使用notitle
plot data u 1:2 w lines notitle, \
     data u 1:3 w points title 'Data Set 2', \
     data u 1:4 w lp title 'Data Set 3', \
     data u 1:5 w bars notitle
这是一个相当重要的技巧。多组数据一起打印的时候,不需要打印所有的标题,这时候notitle特别有效,能让显示的时候特别清晰。
any more?
###想要多张图放在一起?
f(x)=x**2
g(x)=x**3
h(x)=sqrt(x)
plot f(x),g(x),h(x)
###想要打印一个表格?
plot data u 1:2 w lines, data u 1:3 w points, \
data u 1:4 w lp
很多例子
注意这边的 #+begin_src #+end_src 是我在gnuplot的orgmode开启bable模式时候使用,具体你可以看一下如何在gnuplot使用org-mode
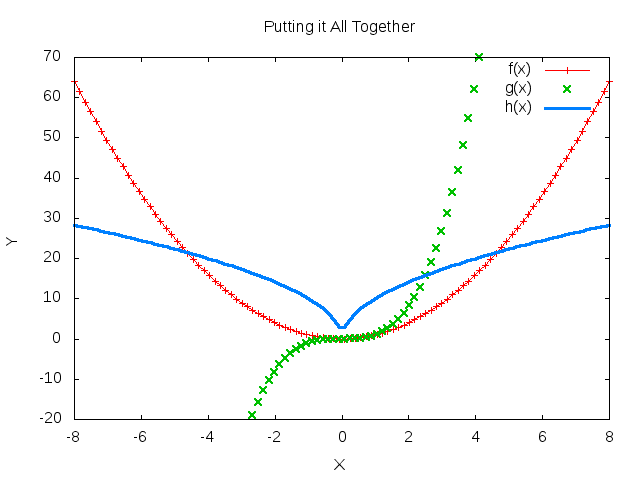
第一个函数打印
#+begin_src gnuplot :exports code :file gnuplot.png
reset

set title "Putting it All Together"

set xlabel "X"
set xrange [-8:8]
set xtics -8,2,8


set ylabel "Y"
set yrange [-20:70]
set ytics -20,10,70

f(x) = x**2
g(x) = x**3
h(x) = 10*sqrt(abs(x))

plot f(x) w lp lw 1, g(x) w p lw 2, h(x) w l lw 3
#+end_src
#+results:
basic-plot的数据表
#+tblname:basic-plot
|   x |         y1 |         y2 |
|-----+------------+------------|
| 0.1 |      0.425 |      0.375 |
| 0.2 |     0.3125 |     0.3375 |
| 0.3 | 0.24999993 | 0.28333338 |
| 0.4 |      0.275 |    0.28125 |
| 0.5 |       0.26 |       0.27 |
| 0.6 | 0.25833338 | 0.24999993 |
| 0.7 | 0.24642845 | 0.23928553 |
| 0.8 |    0.23125 |     0.2375 |
| 0.9 | 0.23333323 |  0.2333332 |
|   1 |     0.2225 |       0.22 |
gnuplot中的打印basic-plot
#+begin_src gnuplot :var data=basic-plot :exports code :file table.png
set title "Putting it All Together"

set xlabel "X"
set xrange [0:1]
set xtics 0,0.1,1

set ylabel "Y"
set yrange [0.2:0.5]
set ytics 0.2,0.05,0.5
plot data u 1:2 w p lw 2 title 'x vs. y1', \
     data u 1:3 w lp lw 1 title 'x vx. y2'
#+end_src
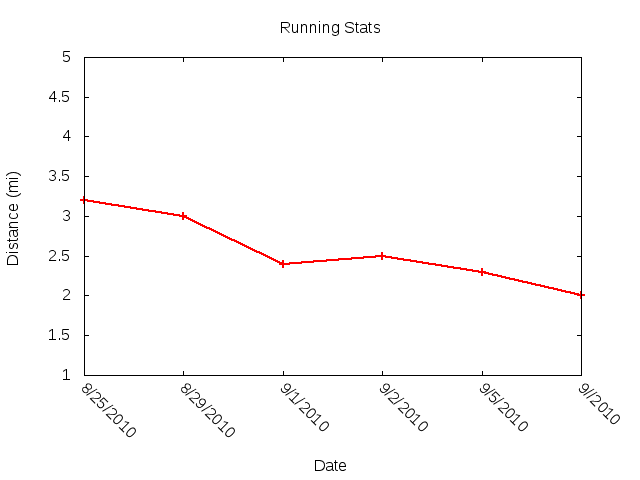
##xtics数据表
#+tblname:xtics
| Date      | Distance |
|-----------+----------|
| 8/25/2010 |      3.2 |
| 8/29/2010 |      3.0 |
| 9/1/2010  |      2.4 |
| 9/2/2010  |      2.5 |
| 9/5/2010  |      2.3 |
| 9//2010   |      2.0 |
gnuplot的gnuplot打印
#+begin_src gnuplot :var data=xtics :exports code :file time.png
  reset

  set title "Running Stats"
  set xlabel "Date"
  set xtics rotate by -45
  set yrange [1:5]
  set ylabel "Distance (mi)"
  plot data u 2:xticlabels(1) w lp lw 2 notitle
#+end_src
#+results:
表格加上标题
#+CAPTION: 表格的标题
| 1 | one                          |
| 2 | two                          |
| 3 | This is a long chunk of text |
| 4 | four                         |
|   | <6>    |
|---+--------|
| 1 | one    |
| 2 | two    |
| 3 | This=> |
| 4 | four   |
表格的特殊使用 用于统计
| 数量 | 单价 |  总额 |
|------+------+-------|
|    2 | 3.55 |   6.9 |
|    4 | 4.34 | 17.36 |
|    5 | 3.44 |  17.2 |
|    5 |  5.6 |   28. |
#+TBLFM: $3=$1*$2
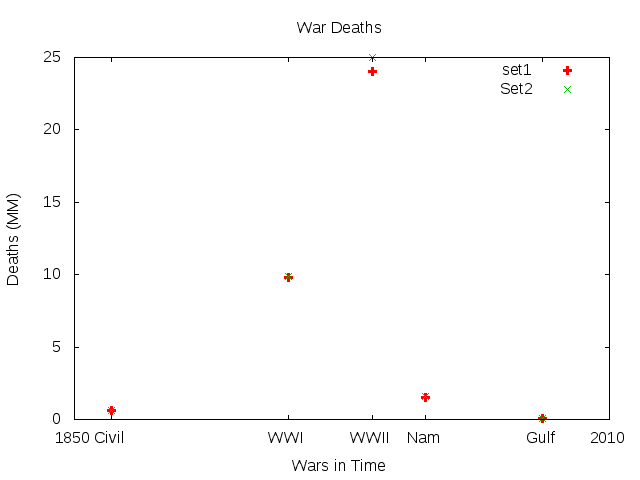
named-xtics 数据表
#+caption: time-history
#+tblname: named-xtics
| tic name | x-value | Dead (y) | Live(l) |
|----------+---------+----------+---------|
| Civil    |    1861 |     0.62 |    0.63 |
| WWI      |    1914 |      9.8 |     9.9 |
| WWII     |    1939 |       24 |      25 |
| Nam      |    1955 |      1.5 |     1.6 |
| Gulf     |    1990 |     0.04 |    0.05 |
#+begin_src gnuplot :var data=named-xtics :exports code :file named.png
reset

set yrange [0:25]
set ylabel "Deaths (MM)"

set xtics ("1850" 1850, "2010" 2010)
set xrange [1850:2010]
set xlabel "Wars in Time"

set title 'War Deaths'

plot data using 2:3:xticlabels(1) w p lw 3 t 'set1',\
     data u 2:4:xticlabels(1) title 'Set2'
#+end_src
#+results:
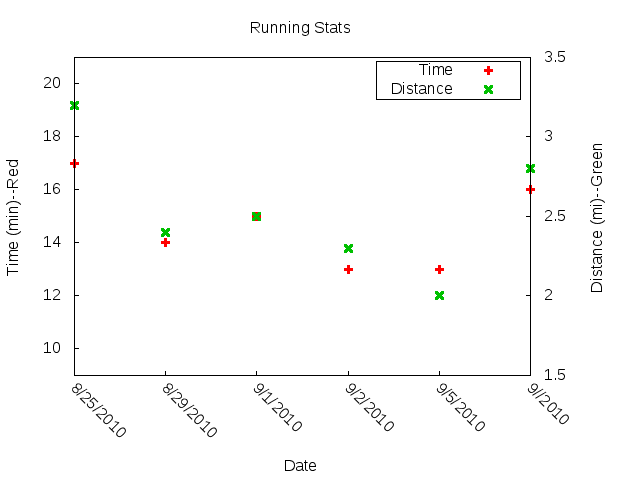
multi-axes数据表
#+tblname:multi-axes
| Date      |  Time | Distance |
|-----------+-------+----------|
| 8/25/2010 | 17:14 |      3.2 |
| 8/29/2010 | 14:00 |      2.4 |
| 9/1/2010  | 15:13 |      2.5 |
| 9/2/2010  | 13:45 |      2.3 |
| 9/5/2010  | 13:20 |      2.0 |
| 9//2010   | 16:35 |      2.8 |
#+begin_src gnuplot :var data=multi-axes :exports code :file multi.png
  reset

  set title "Running Stats"
  set size ratio square
  set key box linestyle -1

  set xlabel "Date"
  set xtics nomirror rotate by -45

  set yrange [9:21]
  set ylabel "Time (min)--Red"
  set ytics nomirror

  set y2range [1.5:3.5]
  set y2label "Distance (mi)--Green"
  set y2tics 0,0.5,3.5

  set style data points
  plot data u 2:xticlabels(1) axis x1y1 lw 3 title 'Time', \
       data u 3:xticlabels(1) axis x1y2 lw 3 title 'Distance'
#+end_src
#+results:
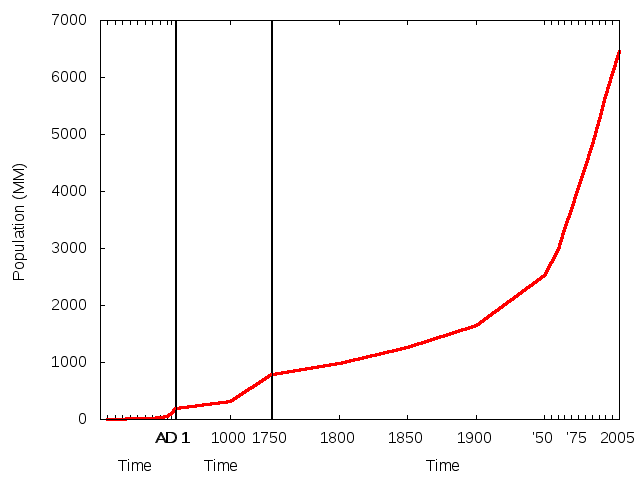
diff-scales数据表
#+tblname:diff-scales
| tic name |    x-loc |  Pop |
|   10k BC | -10000 1 |      |
|          |    -9000 |    3 |
|          |    -8000 |    5 |
|          |    -7000 |    7 |
|          |    -6000 |   10 |
|          |    -5000 |   15 |
|          |    -4000 |   20 |
|          |    -3000 |   25 |
|          |    -2000 |   35 |
|          |    -1000 |   50 |
|          |     -500 |  100 |
|     AD 1 |        1 |  200 |
|     1000 |     1000 |  310 |
|     1750 |     1750 |  791 |
|     1800 |     1800 |  978 |
|     1850 |     1850 | 1262 |
|     1900 |     1900 | 1650 |
|     \'50 |     1950 | 2519 |
|          |     1955 | 2756 |
|          |     1960 | 2982 |
|          |     1965 | 3335 |
|          |     1970 | 3692 |
|     \'75 |     1975 | 4068 |
|          |     1980 | 4435 |
|          |     1985 | 4831 |
|          |     1990 | 5263 |
|          |     1995 | 5674 |
|          |     2000 | 6070 |
|     2005 |     2005 | 6454 |
#+begin_src gnuplot :var data=diff-scales :exports code :file scales.png
  reset

  set xrange [ -10000 : 1 ]
  set yrange [ 0 : 7000 ]
  set xlabel "Time"

  set multiplot

  set size 0.275,1
  set origin 0.0,0.0
  set lmargin 10
  set rmargin 0
  set ylabel "Population (MM)"
  set ytics nomirror
  plot data using 2:3:xticlabels(1) with lines lw 3 notitle

  set origin 0.275,0.0
  set size 0.15,1
  set format y ""
  set noytics
  set lmargin 0
  set rmargin 0
  set xrange [2 : 1750]
  set ylabel ""
  plot data using 2:3:xticlabels(1) with lines lw 3 notitle

  set origin 0.425,0.0
  set size 0.575,1
  set format y ""
  set noytics
  set lmargin 0
  set rmargin 2
  set xrange [1751 : 2005]
  set ylabel ""
  plot data using 2:3:xticlabels(1) with lines lw 3 notitle

  set nomultiplot
#+end_src
#+results:
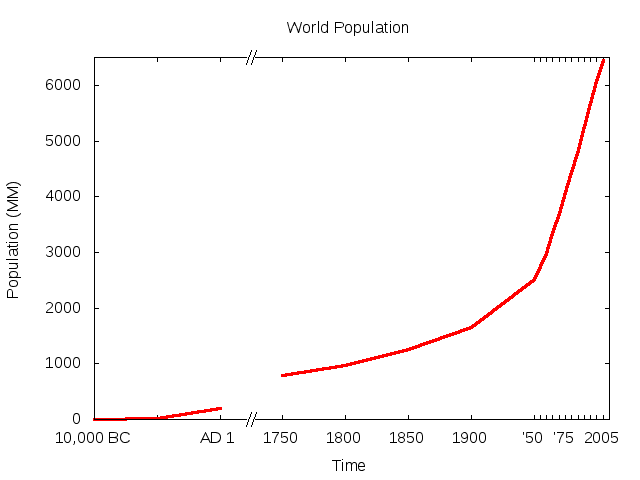
broken-axis 数据表
#+tblname: broken-axis
|  tic name | x-loc | Pre | Post |
| 10,000 BC |  1600 |   1 |      |
|           |  1650 |  15 |      |
|      AD 1 |  1700 | 200 |      |
|      1750 |  1750 |     |  791 |
|      1800 |  1800 |     |  978 |
|      1850 |  1850 |     | 1262 |
|      1900 |  1900 |     | 1650 |
|      \'50 |  1950 |     | 2519 |
|           |  1955 |     | 2756 |
|           |  1960 |     | 2982 |
|           |  1965 |     | 3335 |
|           |  1970 |     | 3692 |
|      \'75 |  1975 |     | 4068 |
|           |  1980 |     | 4435 |
|           |  1985 |     | 4831 |
|           |  1990 |     | 5263 |
|           |  1995 |     | 5674 |
|           |  2000 |     | 6070 |
|      2005 |  2005 |     | 6454 |
#+begin_src gnuplot :var data=broken-axis :exports code :file broken.png
  reset

  A=1725
  B=1600
  C=2010
  D=0
  E=6500

  xoff=.005*(C-B)
  yoff=.02*(E-D)

  set arrow 1 from A-xoff, D to A+xoff, D nohead lw 2 lc rgb "#ffffff" front
  set arrow 2 from A-xoff, E to A+xoff, E nohead lw 2 lc rgb "#ffffff" front
  set arrow 3 from A-xoff-xoff, D-yoff to A+xoff-xoff, D+yoff nohead front
  set arrow 4 from A-xoff+xoff, D-yoff to A+xoff+xoff, D+yoff nohead front
  set arrow 5 from A-xoff-xoff, E-yoff to A+xoff-xoff, E+yoff nohead front
  set arrow 6 from A-xoff+xoff, E-yoff to A+xoff+xoff, E+yoff nohead front

  set xrange [B:C]
  set yrange [D:E]

  set xlabel 'Time'
  set ylabel 'Population (MM)'
  set title 'World Population'

  plot data u 2:3:xticlabels(1) w l lw 3 notitle, data u 2:4:xticlabels(1) w l lw 3 lc 1 notitle

#+end_src
令狐冲
Engineer of offshore wind turbine technique research
My research interests include distributed energy, wind turbine power generation technique , Computational fluid dynamic and programmable matter.